RINalyzer Tutorials
Tutorials for Cytoscape 3.x
Tutorials for Cytoscape 2.x
In the following, screenshots for each step appear when hovering the mouse over (image). If you cannot see the whole image, you can use the keyboard arrows to move to the right or to the bottom while holding the mouse over the image.
Perform comparison
- Retrieve the RIN data for two myoglobin structures with PDB entries 1mbn (image
 ) and 1mbo (image
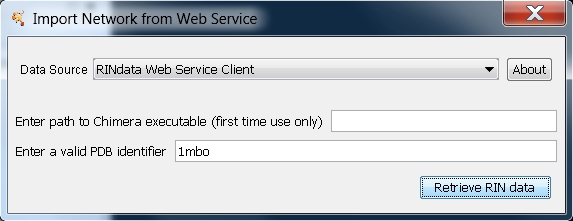 ) using the RINdata Web Service in Cytoscape (see first part of Tutorial 1 for instructions. Once ready, your screen should look as in this image
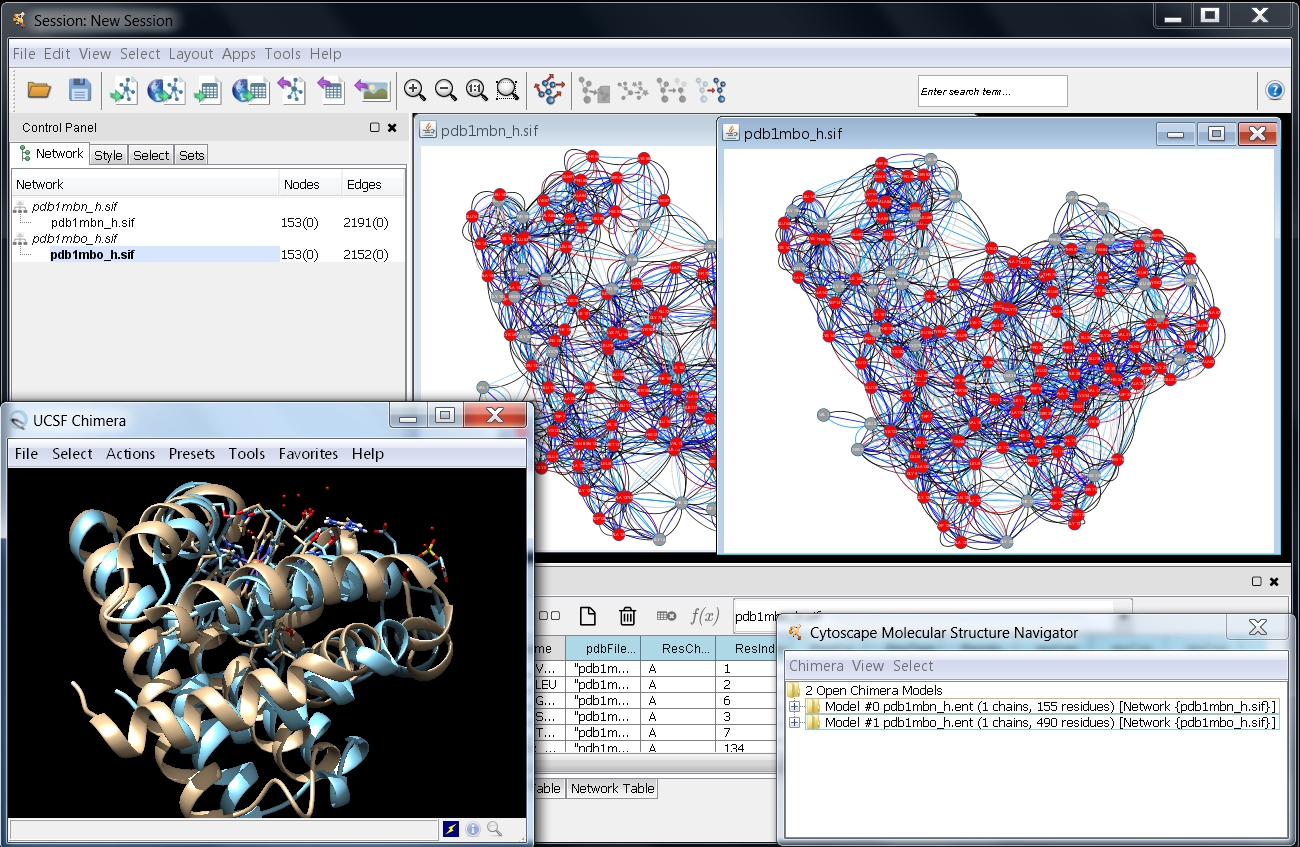 .
.
- Go to Apps → RINalyzer → Compare RINs (image
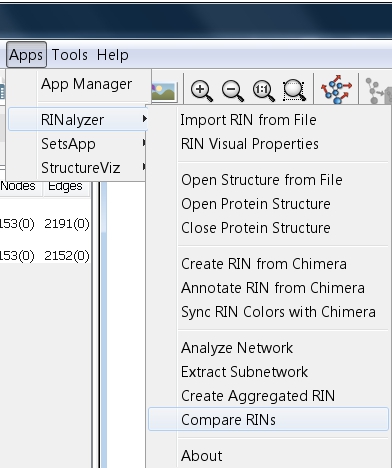 ).
).
- Adjust the comparison settings:
- Enter a name for the new network, e.g., comparison.
- The first (reference) network should automatically be set to pdb1mbn_h.sif and the second (match) network to pdb1mbo_h.sif (image
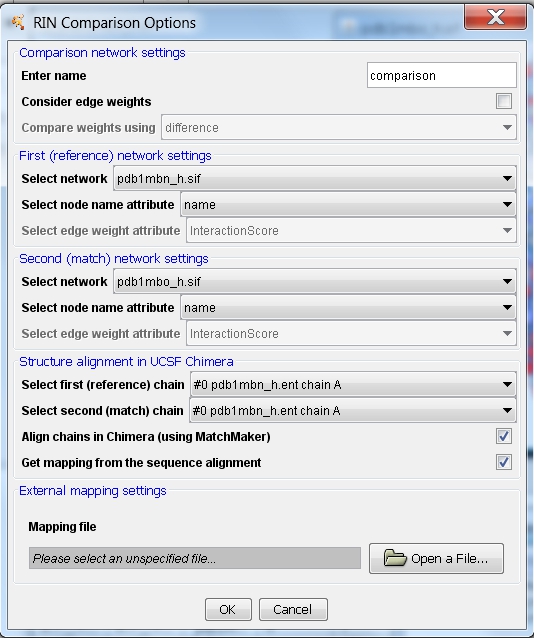 ).
).
- The firs (reference) chain should be set to #0 pdb1mbn_h.ent chain A. Select #1 pdb1mbo_h.ent chain A as the second (match) chain (image
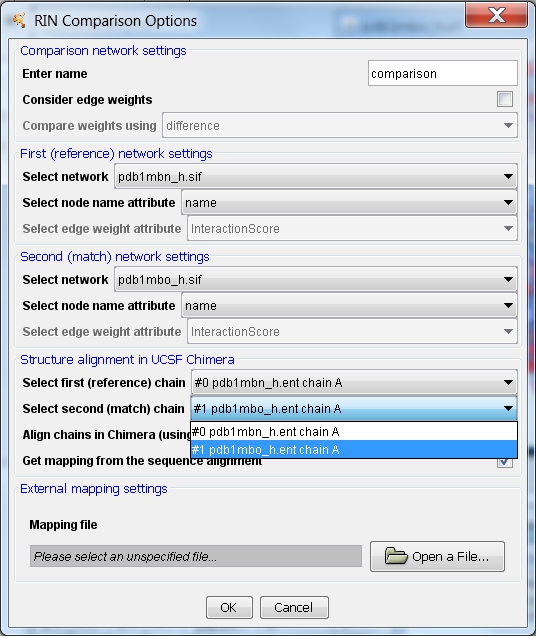 ).
).
- The options Align chains in Chimera (using MatchMaker) and Get mapping from the sequence alignment should be checked automatically if protein structures are open in UCSF Chimera.
- Click the OK button to perform the comparison (image
 ).
).
- A new network with 153 nodes and 2550 edges is created and the two protein structures are aligned (image
 ). Solid black lines represent interactions present in both networks, dashed green lines interactions in the first network only, and dotted red lines interactions in the second network only.
- Customize the network view for interpreting the result:
- Go to Apps → RINalyzer → Visual Properties (image
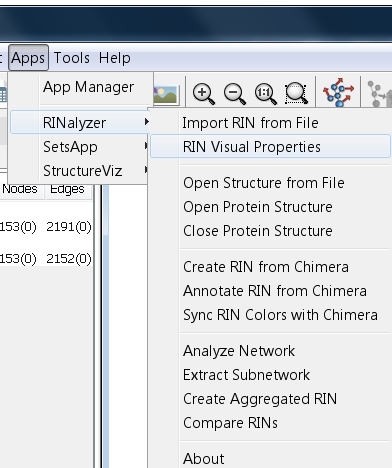 ).
).
- Hide all edges except combi:all_all by unchecking the boxes beside each edge type and close the RIN Visual Properties dialog (image
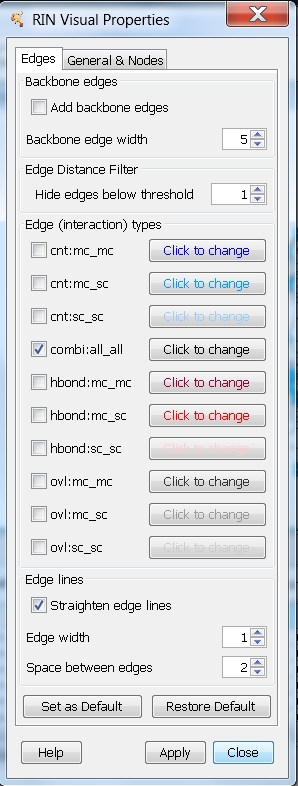 ).
).
- If the previous action changes the current visual style applied to the network view, you can switch back to the right one by selecting the Style tab in the Control Panel and clicking the drop-down list comparison (image
 ) to select the default comparison network style called Comparison style (image
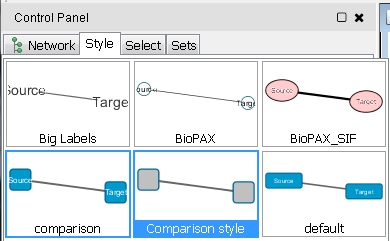 ) or the alternative Comparison style RIN, which retains the default edge interaction colors.
- Rotate the aligned structures and adjust the node positions:
- In UCSF Chimera, rotate the aligned myoglobin structures to see the HEM group and the bound oxygen molecule (image
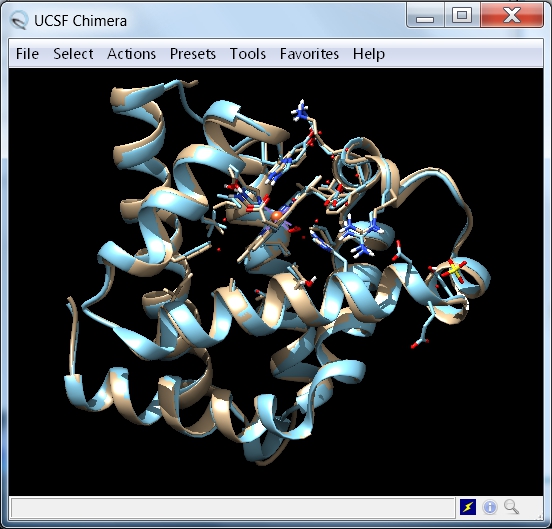 ).
).
- In Cytoscape, go to Layout → RIN Layout to apply the RIN Layout considering the new coordinates of the 3D structures (image
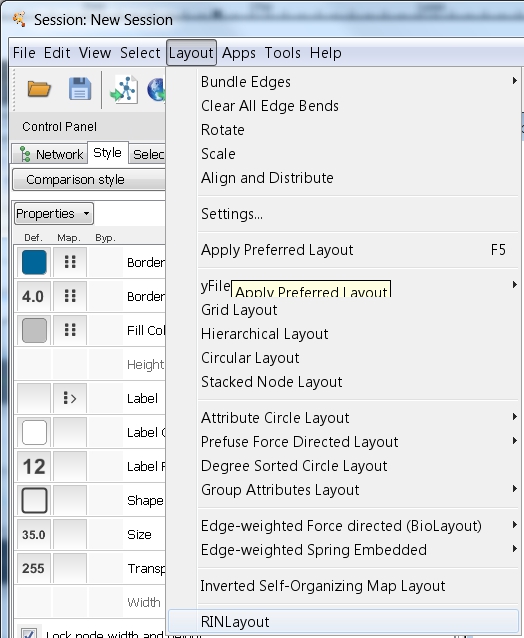 ).
).
- Your screen should look similar to this image
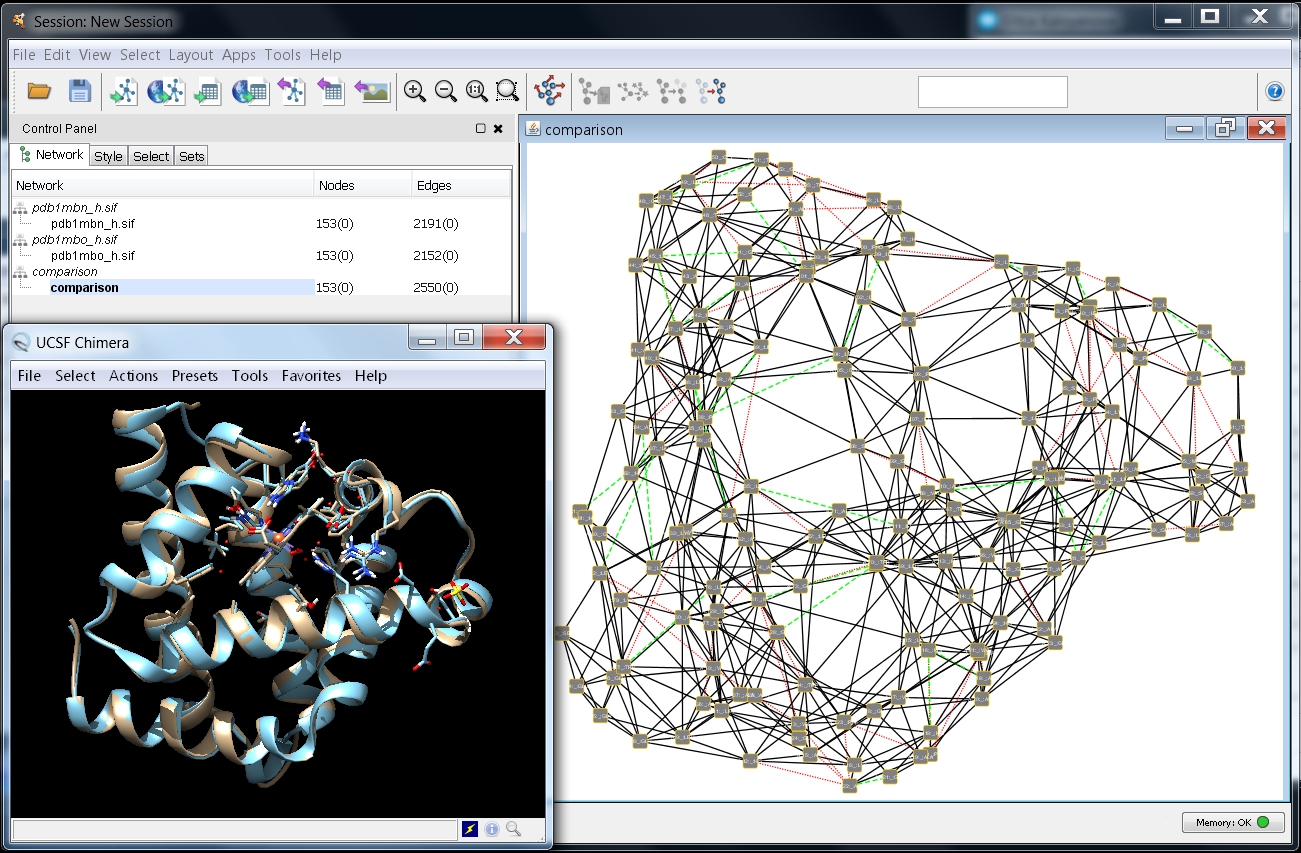 .
.
- If you would like to see how the HEM group interacts with the myoglobin residues, you can create a RIN from UCSF Chimera following tutorial 2.
Select nodes with most edges belonging only to one of the networks:
- In the Control Panel, select the Select tab (image
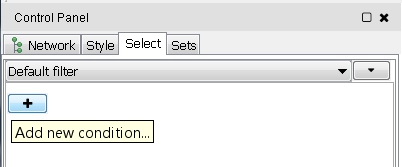 ) to create new node or edge filters.
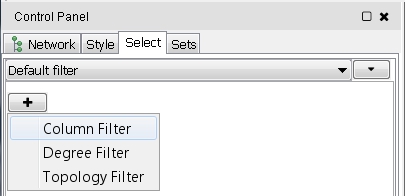
- Click the + button to add a new filter and select Column Filter from the drop-down list (image
 ) for an attribute-based filter.
- Click the Choose column... drop-down list and select the entry Node: EdgeFracBoth (image
 ).
).
- Move the left arrow of the slider to the right to increase the range, for example to .600 (image
 ).
).
- Now, the network looks as in this image
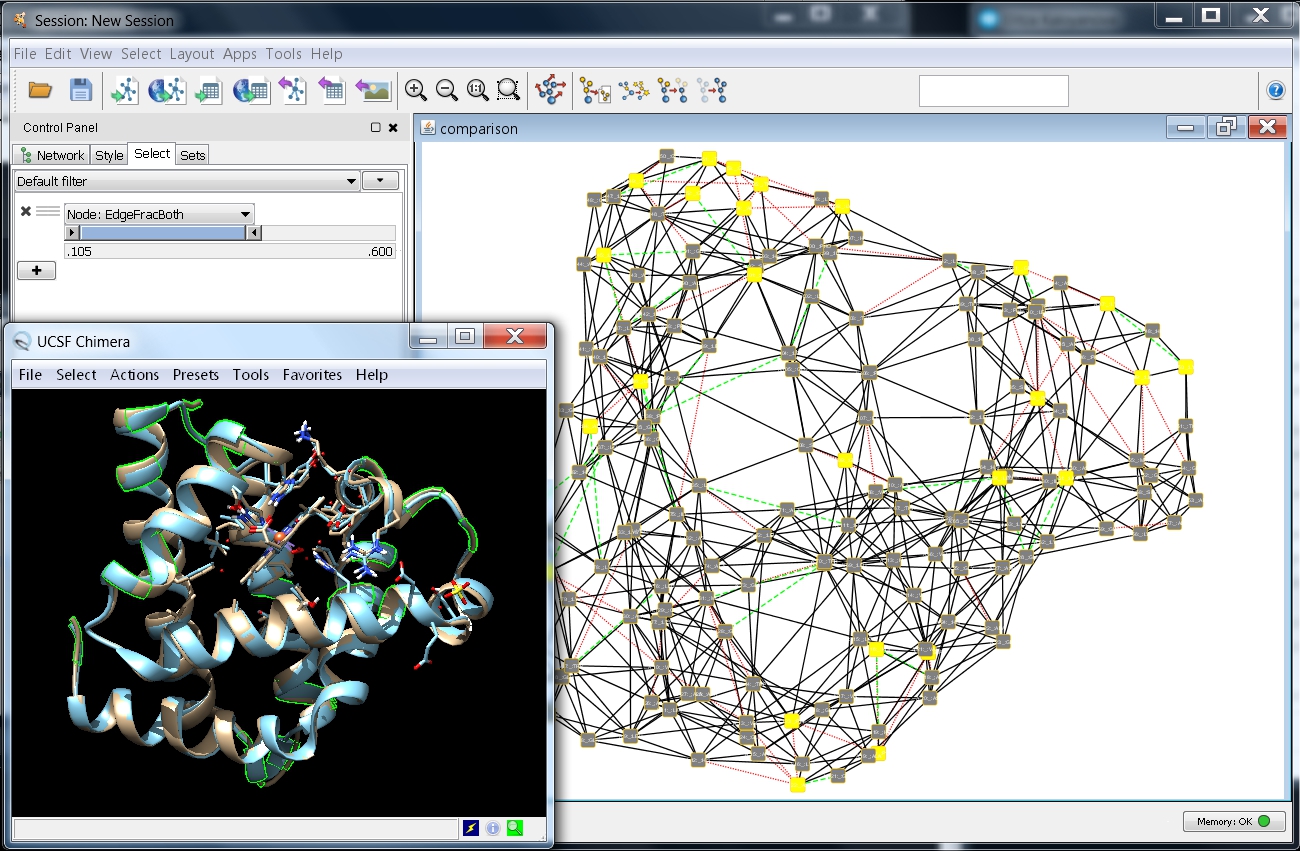 and by zooming-in you can observe the residue interaction differences between the superimposed myoglobin structures.


 ) and 1mbo (image
 ) using the RINdata Web Service in Cytoscape (see first part of Tutorial 1 for instructions. Once ready, your screen should look as in this image
 .
. ).
). ).
). ).
).  ).
). ). Solid black lines represent interactions present in both networks, dashed green lines interactions in the first network only, and dotted red lines interactions in the second network only.
 ).
). ).
).  ) to select the default comparison network style called Comparison style (image
 ) or the alternative Comparison style RIN, which retains the default edge interaction colors.
 ).
). ).
). .
. ) to create new node or edge filters.
  ) for an attribute-based filter.
 ).
). ).
). and by zooming-in you can observe the residue interaction differences between the superimposed myoglobin structures.