max planck institut
informatik
informatik

In the following, screenshots for each step appear when hovering the mouse over (image). If you cannot see the whole image, you can use the keyboard arrows to move to the right or to the bottom while holding the mouse over the image.
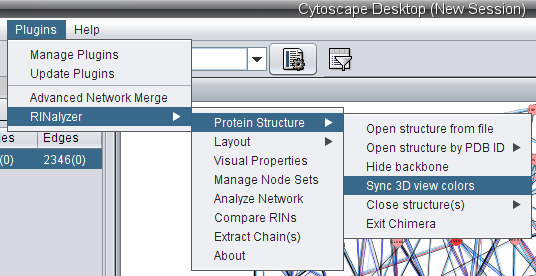
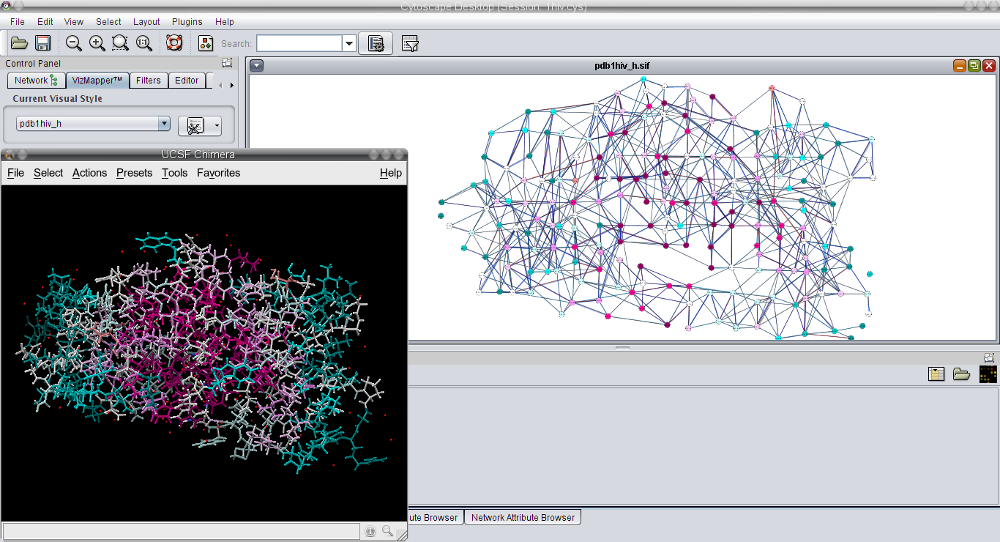
In this tutorial, it is assumed that you have followed the steps described in Tutorial 1, i.e. the Cytoscape session pdb1hiv_h.cys is opened and the corresponding 3D structure is loaded in Chimera.
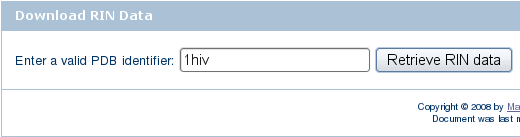 ) and click the Search for RIN data button.
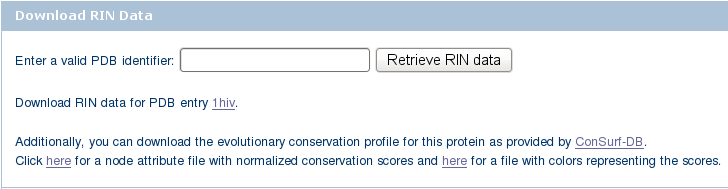 ).
). ) and save the file to your local file system (image
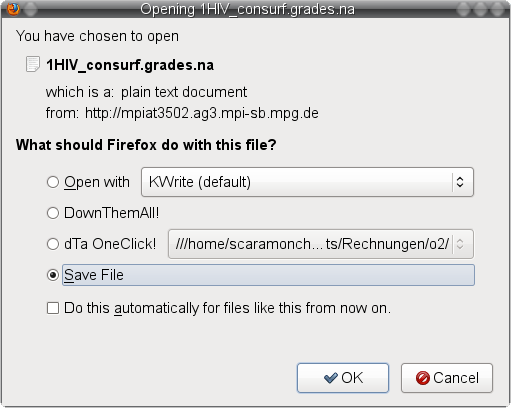 ) under the name 1HIV_consurf.grades_scores.na (image
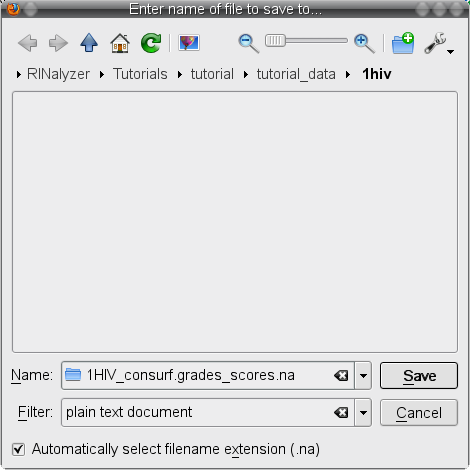 ).
). ) and save the file to your local file system (image
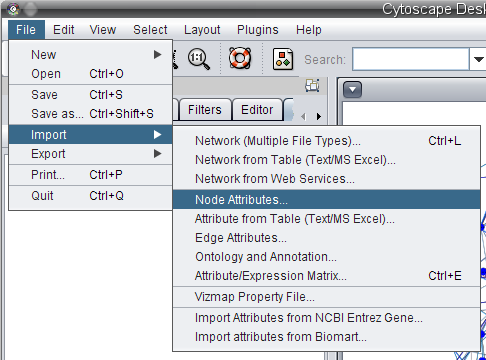
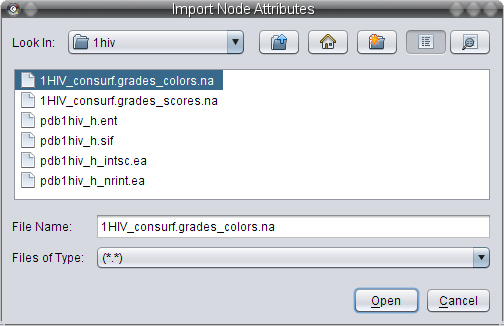
 ) under the name 1HIV_consurf.grades_colors.na (image
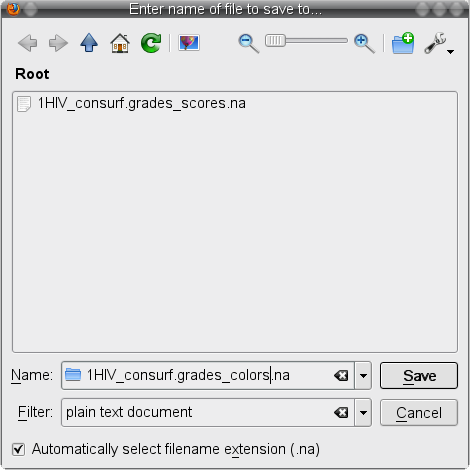 ).
). ).
).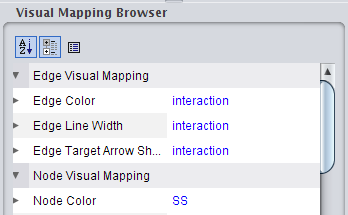 ), click on the right field to change the attribute to ResidueConsurfColor (image
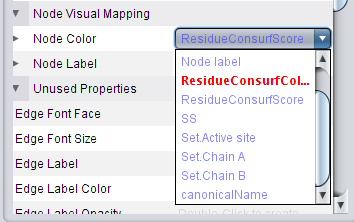 ) and change the mapping type to Discrete Mapping (image
 ).
). ). You can set color for each value by clicking on the right field in the row (image
 ) and then on the ... button.
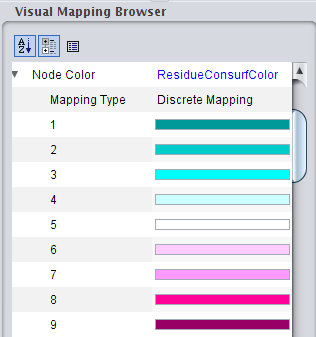 .
. ).
). .
.